
Data is invaluable for advancing students’ learning. But education officials can only act on this information if it is properly analyzed for useful insights. That’s why pausing to gather “data about data” is a key component of the Data Driven Districts (DDD) program.
The DDD program recently partnered with the Research on Socioeconomic Policy (RESEP) group at the University of Stellenbosch to evaluate a limited section of anonymized education data from Limpopo Province. Researchers aimed to uncover the most up-to-date insights on what’s happening in education to spur discussions on how education officials can continue to move forward.
Servaas van der Berg, Professor of Economics and National Research Foundation’s Chair in the Economics of Social Policy, Stellenbosch University, and Principal Investigator for this analysis, stated this about the project, “Education policymakers have only just begun to discover the value school administrative data plays with decision making and interventions. Now that such data has been collected for a number of years, it becomes possible to track learners over time. This immediately allows a better understanding of dropout and repetition trends but also how these are linked to performance in school-based assessments tests. This opens new possibilities, for instance for subject advisers to provide better assistance to teachers on the quality of the assessments, but also how better to support learners at risk at an earlier stage.”
Here are a few key insights and recommendations from RESEP’s review, which illustrate how data analysis can further benefit learners and education officials.
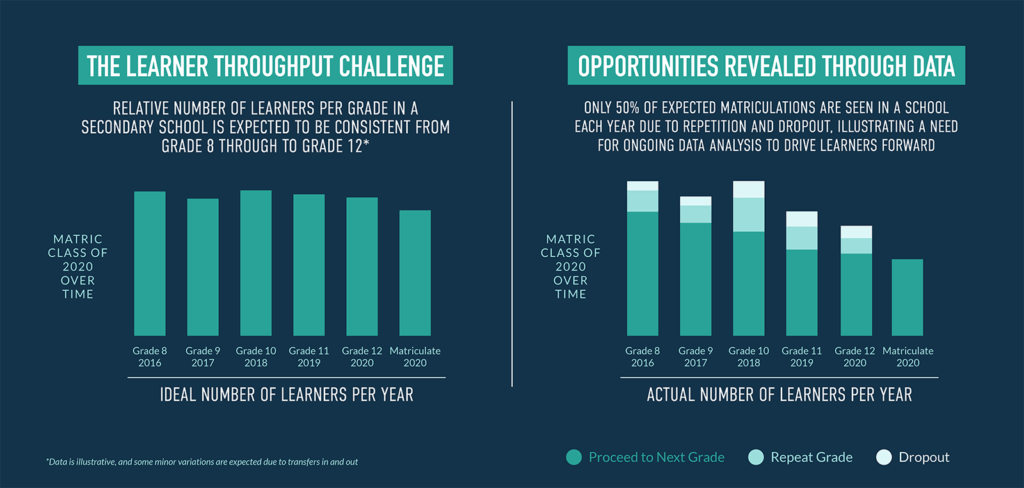
Visualize the learner throughput challenge
Using the data, RESEP identified a scenario to measure a school’s efficiency by following learners’ progress through high school, from grades eight to 12. The data show how many learners move on to the next grade and how many stay behind, which helps school officials understand where more work is needed to ensure learners advance. For example, if a high school has 1,000 learners, with 200 learners per grade, ideally 200 learners will progress to the next grade level each year and 200 learners will matriculate. But instead, the data analyzed by RESEP show that only 100 learners advance—which means the high school system is operating at 50% efficiency.
While the DDD data-enabled RESEP to measure learners’ throughput at the classroom level, the data does not track the progress of any individual learner. If the data included a unique identifier for each learner—such as an ID number or student code—education officials would be able to better analyze learner throughput regularly, with much less effort. Officials could then drive ongoing interventions, make data-informed decisions, and take the next steps to ensure learners have opportunities to grow and succeed. This type of data would benefit every learner in the system.
Prioritize the teacher pipeline
Although not “new news,” RESEP confirmed South Africa’s teaching workforce is nearing retirement age, which will exacerbate the teacher shortage across the country. In Limpopo, data show that half of the teaching workforce will reach retirement age in the next 10 years. With this data at hand, Limpopo’s education officials can prioritize building the province’s teacher workforce starting now, rather than waiting until the number of teachers shrinks.
Prioritizing the teacher pipeline also relates to learner throughput. If education officials can ensure more learners successfully matriculate within the next few years, the province will have more qualified young people ready to pursue teaching careers.
Continue the momentum
While challenges in the education sector continue, this analysis was a reminder of the positive momentum that is happening across South Africa. The data show growth in education rates over time, with Limpopo residents becoming better educated now than in the 1970s. This is positive momentum—and it hints at what’s possible when education is prioritized.
Ongoing efforts like these to make data visible help education officials see what’s working. And they help leaders identify where resources are needed to support learners’ and teachers’ success. Everyone plays a part in collecting data that can drive progress, including:
- Schools, which can ensure teachers and other officials capture quality data.
- The education sector, which can invest in universally adopted unique identifiers for learners.
- Policy owners, who can monitor learners’ throughput, focus interventions, and optimize resources to help learners progress with minimal repetition and dropout. These efforts will channel young adults toward important job pipelines such as teaching.
Thank you to all the education data champions across the country. You play a valuable role in creating new growth opportunities for our learners.
The Data Driven Districts (DDD) Programme, owned by the Department of Basic Education and implemented in partnership with New Leaders Foundations, aims to put quality education data into the hands of those who want to and can improve education in South Africa.
Learner Flows through Schools
Learn more about using high-quality administrative data to understand education system performance in this report from RESEP.
Download the PDF Report